
Data on Food Waste By Country 2025
Recent data closest to data of 2025
FACTS AND DATA
GW Authors
5/20/20263 min read
Recent data of food waste from 2025 is still under going, as it's still being collected. That being said, we can use estimates from UNEP of 2024 to get an idea.
Recent data of food waste from 2025 is still under going, as it's still being collected. That being said, we can use estimates from UNEP of 2024 to get an idea. Although a bit different from our own calculations.
While we are evaluating the global food waste landscape, the statistical baseline relies on the landmark UNEP Food Waste Index. This remains the most comprehensive, up-to-date global dataset available, serving as the benchmark framework for international climate initiatives, like the Food Waste Breakthrough campaign launched at the COP30 climate summit.
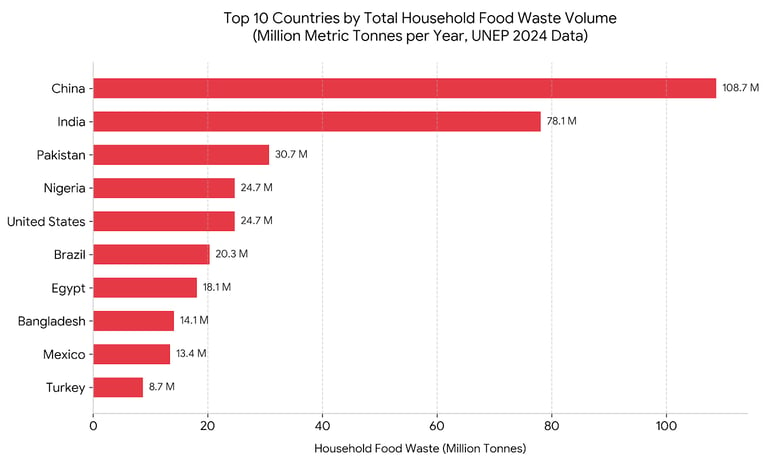
Graph 1: Top 10 Countries by Total Household Food Waste Volume
This graph shows the absolute tonnage of food wasted in homes every year. It naturally emphasizes highly populated nations, demonstrating where the largest logistical opportunities for organic waste management lie.
China: 108.7 million tonnes/year}
India: 78.1 million tonnes/year
Pakistan: 30.7 million tonnes/year
United States: 24.7 million tonnes/year
Nigeria: 24.7million tonnes/year
Brazil: 20.3 million tonnes/year
Egypt: 18.1 million tonnes/year
Bangladesh:14.1 million tonnes/year
Mexico: 13.4 million tonnes/year
Turkey: 8.7 million tonnes/year
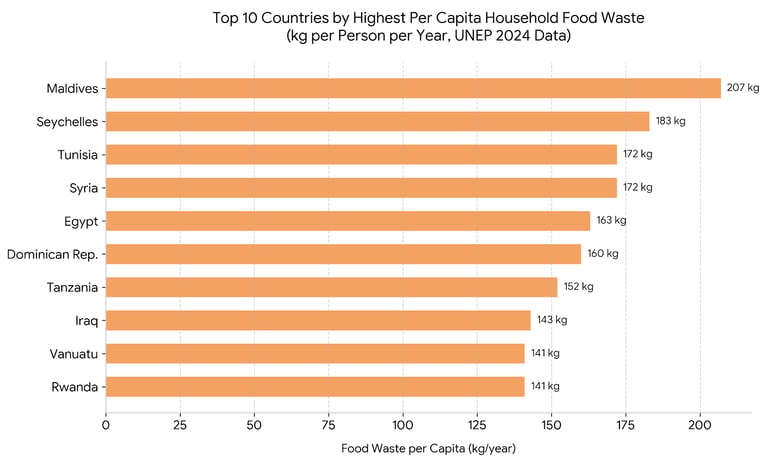
Graph 2: Top 10 Countries by Highest Per Capita Food Waste
When population size is filtered out, this graph illustrates how much food the average individual resident throws away annually. It highlights how hot climates, high tourism rates, or decentralized cold-chain infrastructure (lack of refrigeration during transport) compound regional waste.
Maldives: 207 kg/year
Seychelles: 183 kg/year
Syria: 172 kg/year
Tunisia: 172 kg/year
Egypt: 163 kg/year
Dominican Republic: 160 kg/year
Tanzania: 152 kg/year
Iraq: 143 kg/year
Rwanda: 141 kg/year
Vanuatu: 141 kg/year
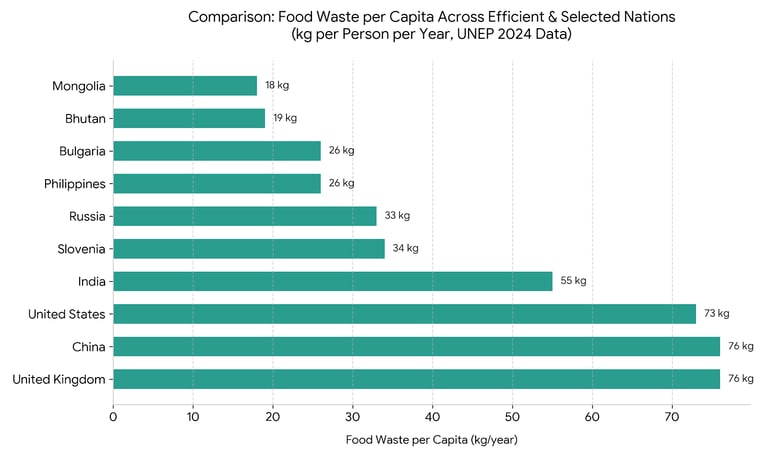
Graph 3: Comparison: Food Waste per Capita Across Efficient & Selected Nations (UNEP Baseline)
This comparison graph maps out the top-performing, low-waste countries alongside global benchmarks like the US, UK, and China. This allows your blog readers to see just how efficient these leading nations are by comparison.
Mongolia (18kg/year) & Bhutan (19kg/year): The global leaders in low food waste. Their pastoral, traditional cultures find practical uses or agricultural loopbacks (feeding livestock) for virtually all food scraps.
Bulgaria (26kg/year) & the Philippines (26kg/year): Lead their respective regions due to deeply ingrained cultural values regarding food resourcefulness, home pickling/canning, and extensive backyard composting.
Slovenia (34kg/year) & Russia (33kg/year): Stand out as highly efficient industrialized states. Slovenia’s success is largely driven by aggressive municipal waste separation and public awareness programs.
The Baselines: For contrast, large economies like India (55 kg), the United States (73 kg), China (76 kg), and the United Kingdom (76kg) showcase the global average range for consumer households.
Sources:
Primary Source: United Nations Environment Programme (UNEP) Food Waste Index Report 2024. This is the global benchmark study that established these country-level metrics by tracking consumer and retail food streams across 102 nations.
Secondary Core Tracker: World Resources Institute (WRI) & Champions 12.3 Coalition. The international coalition monitoring Sustainable Development Goal $12.3$ (the global target to halve retail and consumer food waste by 2030).
Data Compilation: World Population Review (Food Waste by Country Metrics, 2024-2025). The generated image files top_10_food_waste_volume.png, top_10_food_waste_per_capita_high.png, and food_waste_per_capita_comparison_low.png have been saved in high resolution and are fully ready to accompany your write-up.
Contacts
greenlyworld@hotmail.com